
Manual Quoting Engine
Redesigned the manual quoting process to allow for standardized pricing and reduce dev costs as the company scaled to new manufacturing processes, each with their own quoting needs. Massive profits at stake.
Context
The money. Xometry’s AI Auto-Quoting prices a part in seconds from a CAD file, but it didn’t cover advanced requirements like precision tolerances, so the more complex an order, the more likely it was to need a manual quote. Manual quotes often ran as much as 25% cheaper than auto-quotes. Customers were never told, but repeat customers worked it out, and the more they ordered, the more of their orders they sent through Manual Quoting. Repeat customers bring in 60% of Xometry’s $700 million revenue ($420 million), so the gap was costing up to $105 million every year. Pricing manual quotes on the same model as auto-quotes would recover it.
The time. Manual quoting was also slow, and it capped how fast the whole company could grow:
- No integration. Quotes lived in Google Sheets with no link to the ERP or Salesforce. Every customer detail was copied by hand from the ERP into the sheet, and back again when the quote was done.
- Lost detail. The ERP couldn’t hold quotes this complex, so only the key fields were saved. The rest stayed in a sheet somewhere.
- Never locked. Sales, Case Management and Accounting kept going back to the quoter to find room to close a deal, raise the margin or offer a discount.
- No traceability. Those same teams could change the quote the customer saw, with no link back to the original. Every day, hours went into finding out who changed what, why, and which version was current.
My task was to solve all of that.
My Tasks
Results
Key Solutions
- Simpler, expandable table structure
- Risks flagged automatically
- Add screen shots to the quote
- AI-driven related parts
- Remove all manual reference tables
View Detailed ListHide Details
- Research, Design, and build a new Manual Quoting calculator that would be cleaner, easier to teach, easier to learn, faster to use and save money.
- Standardize calculations, components, variables, and interaction patterns
- Manual Pricing should be closer to the Auto-Quoting model
- Flag areas where the Auto-Quoting model needs to be closer to the real-world
- Easy to reuse in newly added manufacturing processes
- Improve traceability
- Make it easier to scan for key info so there are fewer questions needing to be resolved manually.
- Track every edit throughout the process so everything is easily traced.
- Improve efficiency
- Reduce data entry time by improving visual clarity, hierarchy, and scannability
- Build it within the ERP so there are no issues transposing between disconnected systems manually
- Build in new features like using AI to alert the quoter to other similar parts that have been quoted already
- Make it easier for non-quoters to understand so no time is wasted explaining the thinking behind the quote.
- Refocus the UI on the data, tasks and processes, not the navigation structure to increase task completion rates, lower training / maintenance costs
- Reduce risk
- Ensure changes address client pain points without causing any new ones
- Understand all interrelated systems to ensure seamless integration
- Understand all departments / processes to ensure that nothing breaks
- Watch manual quoting being done at full-speed
- Interview, review design, and test with manual quoters
- million in recovered revenue (est. by quoters)
- reduction in quote cycle time (live data)
- Increase in quoting volume (live data)
Time / Team
- 2025-2026
- 1 Product Owner
- 1 Designer (me)
- 1 Quoting Director
- 5 Quoters
- 1 Engineering Lead
- 6 Developers
My Actions: Onboarding
I began by building a rapport with the Product Manager (who was also new to Quoting) and together we decided on doing continuous discovery as the best way to grow our knowledge of this niche user-group. We met with the Director of Manual Quoting at least 45 times during the course of the project to better understand the needs, tools, processes, and ideas on his team. We also met with the dev leads to make sure we were fully versed in how the architecture was built and where it could be adjusted easily. Then we collaborated on the PRD’s outline of our vision, process, and success metrics while he added all the technical specs and I added sketches of the various issues we’d be addressing.
The original spreadsheet
- Where to even start?
- Visual overload is painful
- New hires hated it
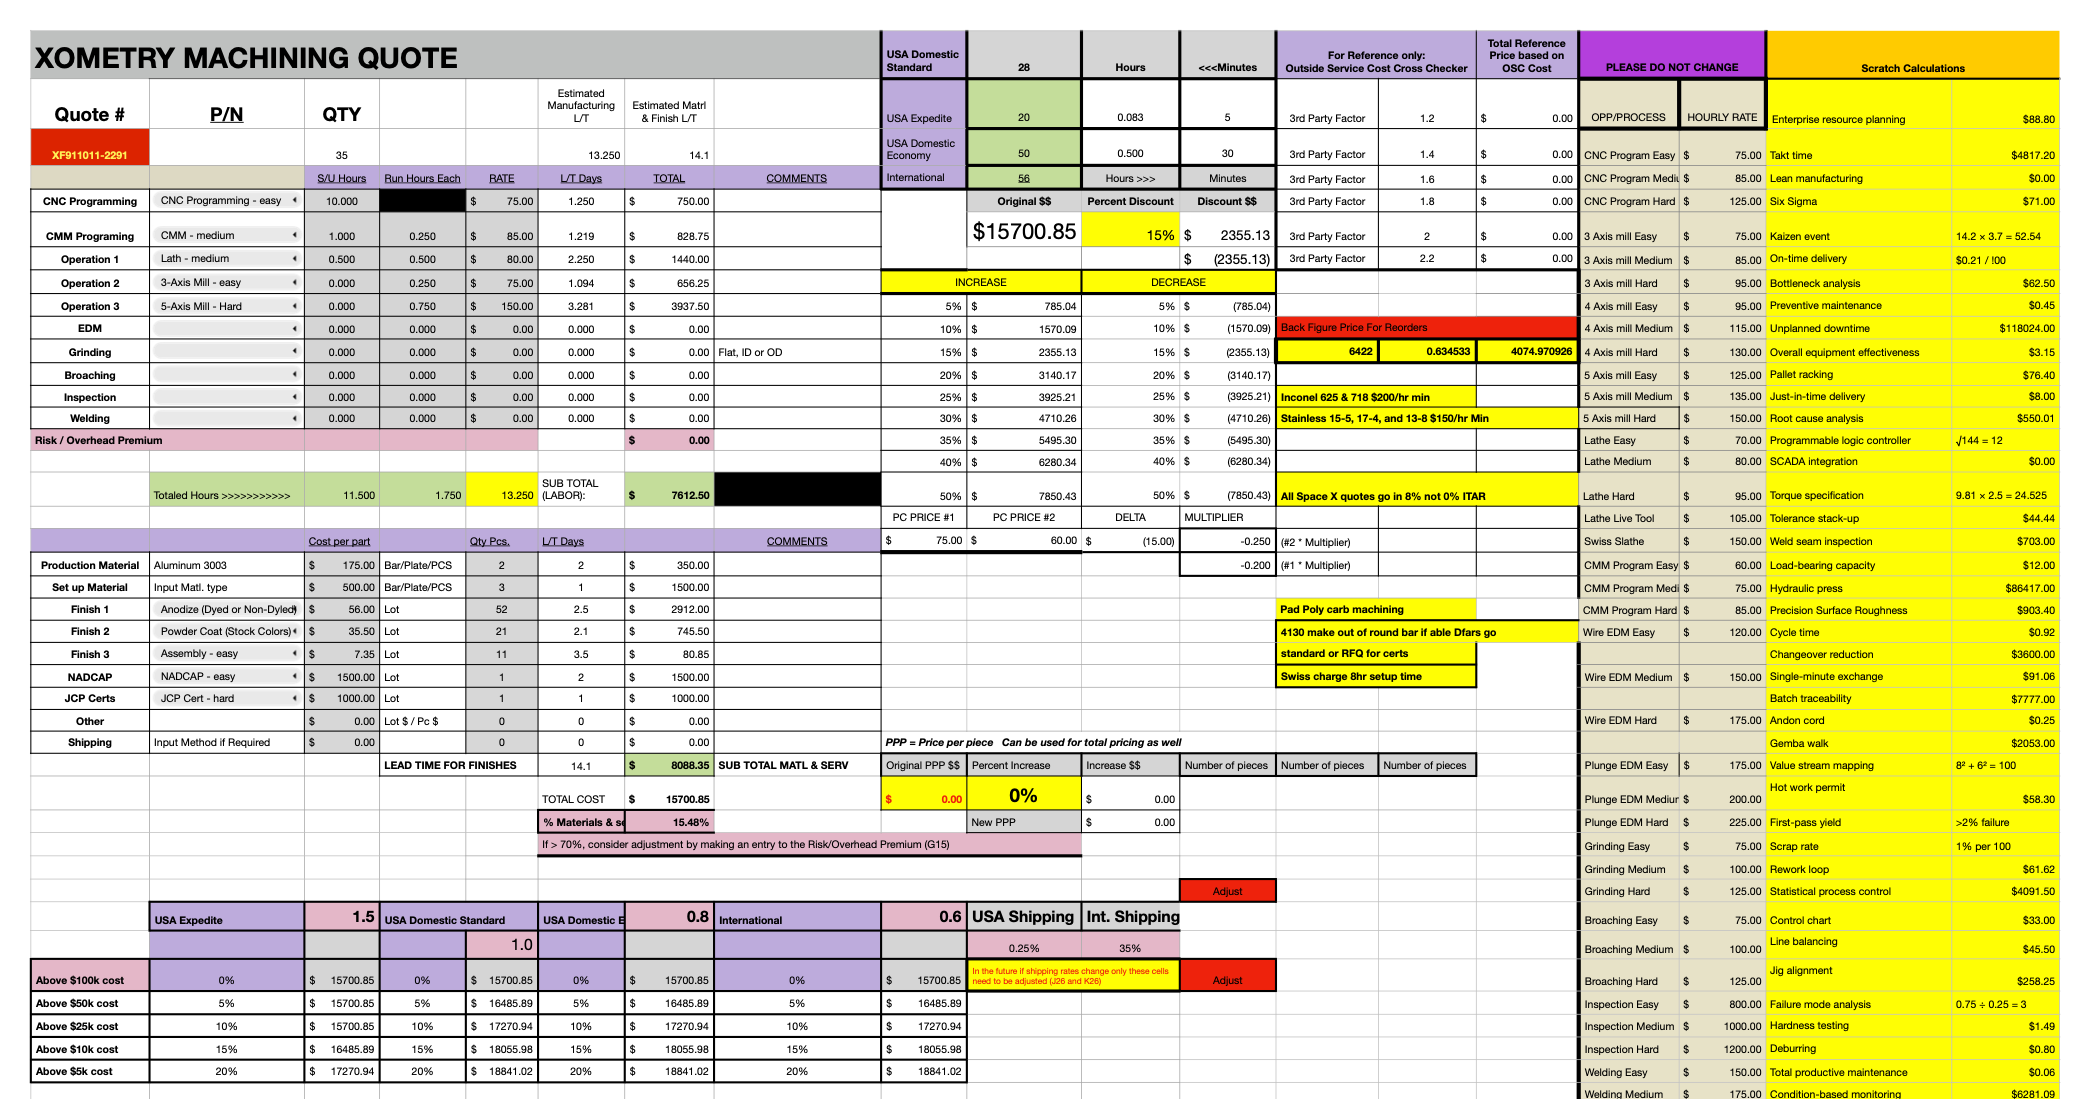
Red means??
Beige means??
Pink means??
Green means??
Bold is over-used
Lavender means??
Purple means??
Orange means?
Yellow means?
Where is the grand total?
Gray means ??
If yellow means “Reference” and red means “warning” then what does red text on a yellow background mean?
Inconsistent border lines
Key summary data bundled with ancillary reference calculators
Irrelevant items shown
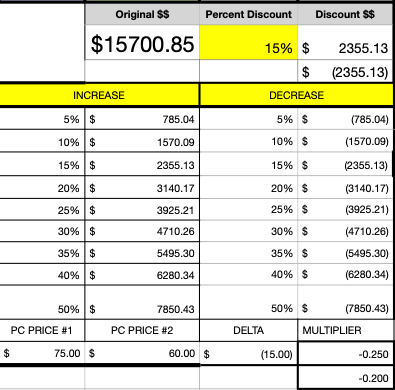
Price adjustment options should be pre-calculated
Manufacturing materials bundled with finishing processes?
Ambiguous context
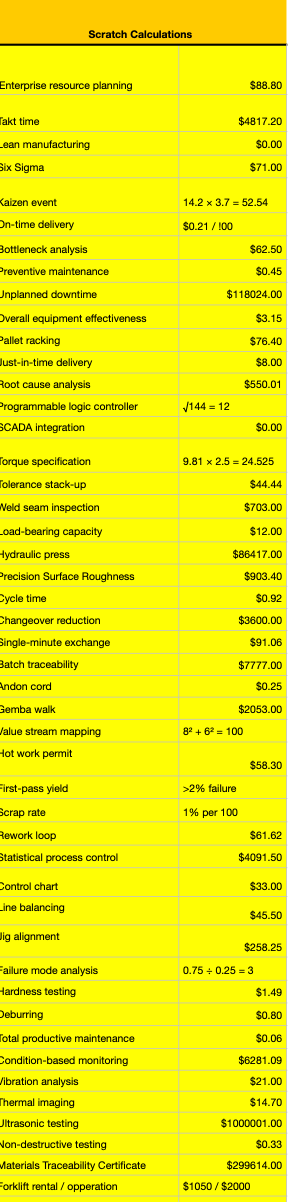
Scratch calculations carried forward into every new quote
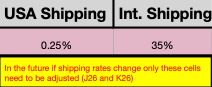
Service-level bundled with volume discounts and shipping costs confuses everyone
Risk adjustment is lost and manually calculated
Shipping is a useless mess: Shipping of materials to the manufacturer - completed parts from manufacturer to finisher - finishing materials to finisher - finished parts to the inspector - inspected parts to the customer - none of these options exist outside of an amorphous “shipping” catch-all bucket.
My Actions: Research + Team Building
Everyone wanted change in theory, but given the speed of the quoters, and the amount of money involved, we needed the quoters not just “onboard” with the idea, we needed them onboard for the entire project from inception through UAT so it would launch with full adoption. We started by assuming we knew nothing about quoting and simply observed. Watching manual quoters completing complex quotes usually in under 90 seconds, all day, every day, we developed deep empathy for them and a renewed commitment to making their jobs easier.
Observation
My Actions: Deconstruction + Confirmation
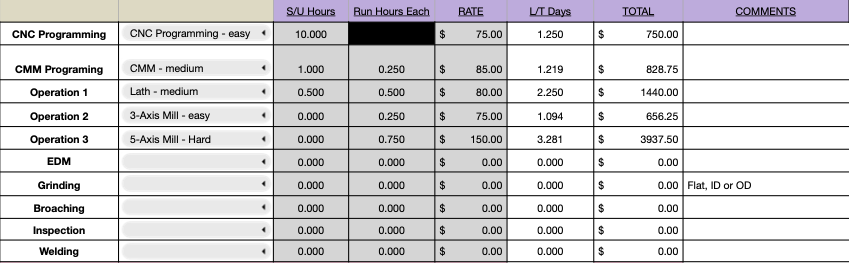
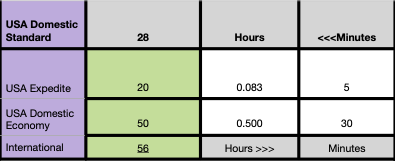
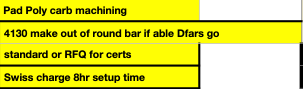
With this many disparate elements embedded on a single spreadsheet being used thousands of times per week, it was crucial that I had a complete understanding of every cell on the sheet so I could better assess the groupings and make sure we didn’t miss any key elements or calculations.
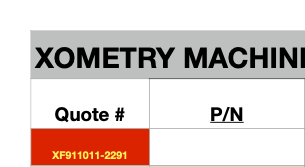

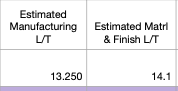









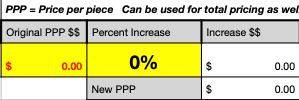
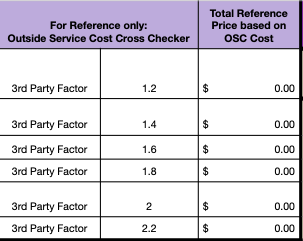

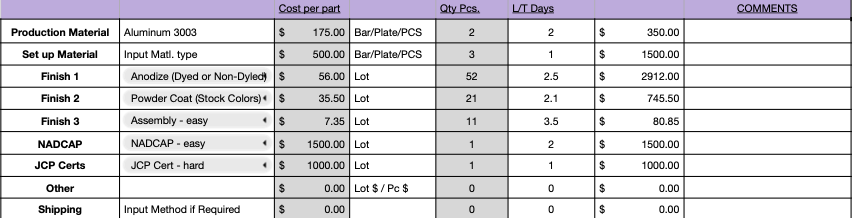
Process type
Quote number
Part number
Risk Correction
Manufacturing Subtotals (cost / lead time)
Materials / Finishes Subtotals (cost / lead time)
Total cost of project
Risk Assessment
Service level
Volume discounts
Generic “Shipping”
Service level
Lead time adjustments
Hours to minutes converters
Manual discount reference chart
Escalating risk as more suppliers, manufacturers, and finishers are added
Lead time summary
Special multipliers for repeat orders
Multipliers for special materials
Misc. notes
Price per part
Shipping Multipliers
Manufacturing Processes
Finishing Processes
Rates per process
Misc. calculations
QTY
My Actions: Solution Concept
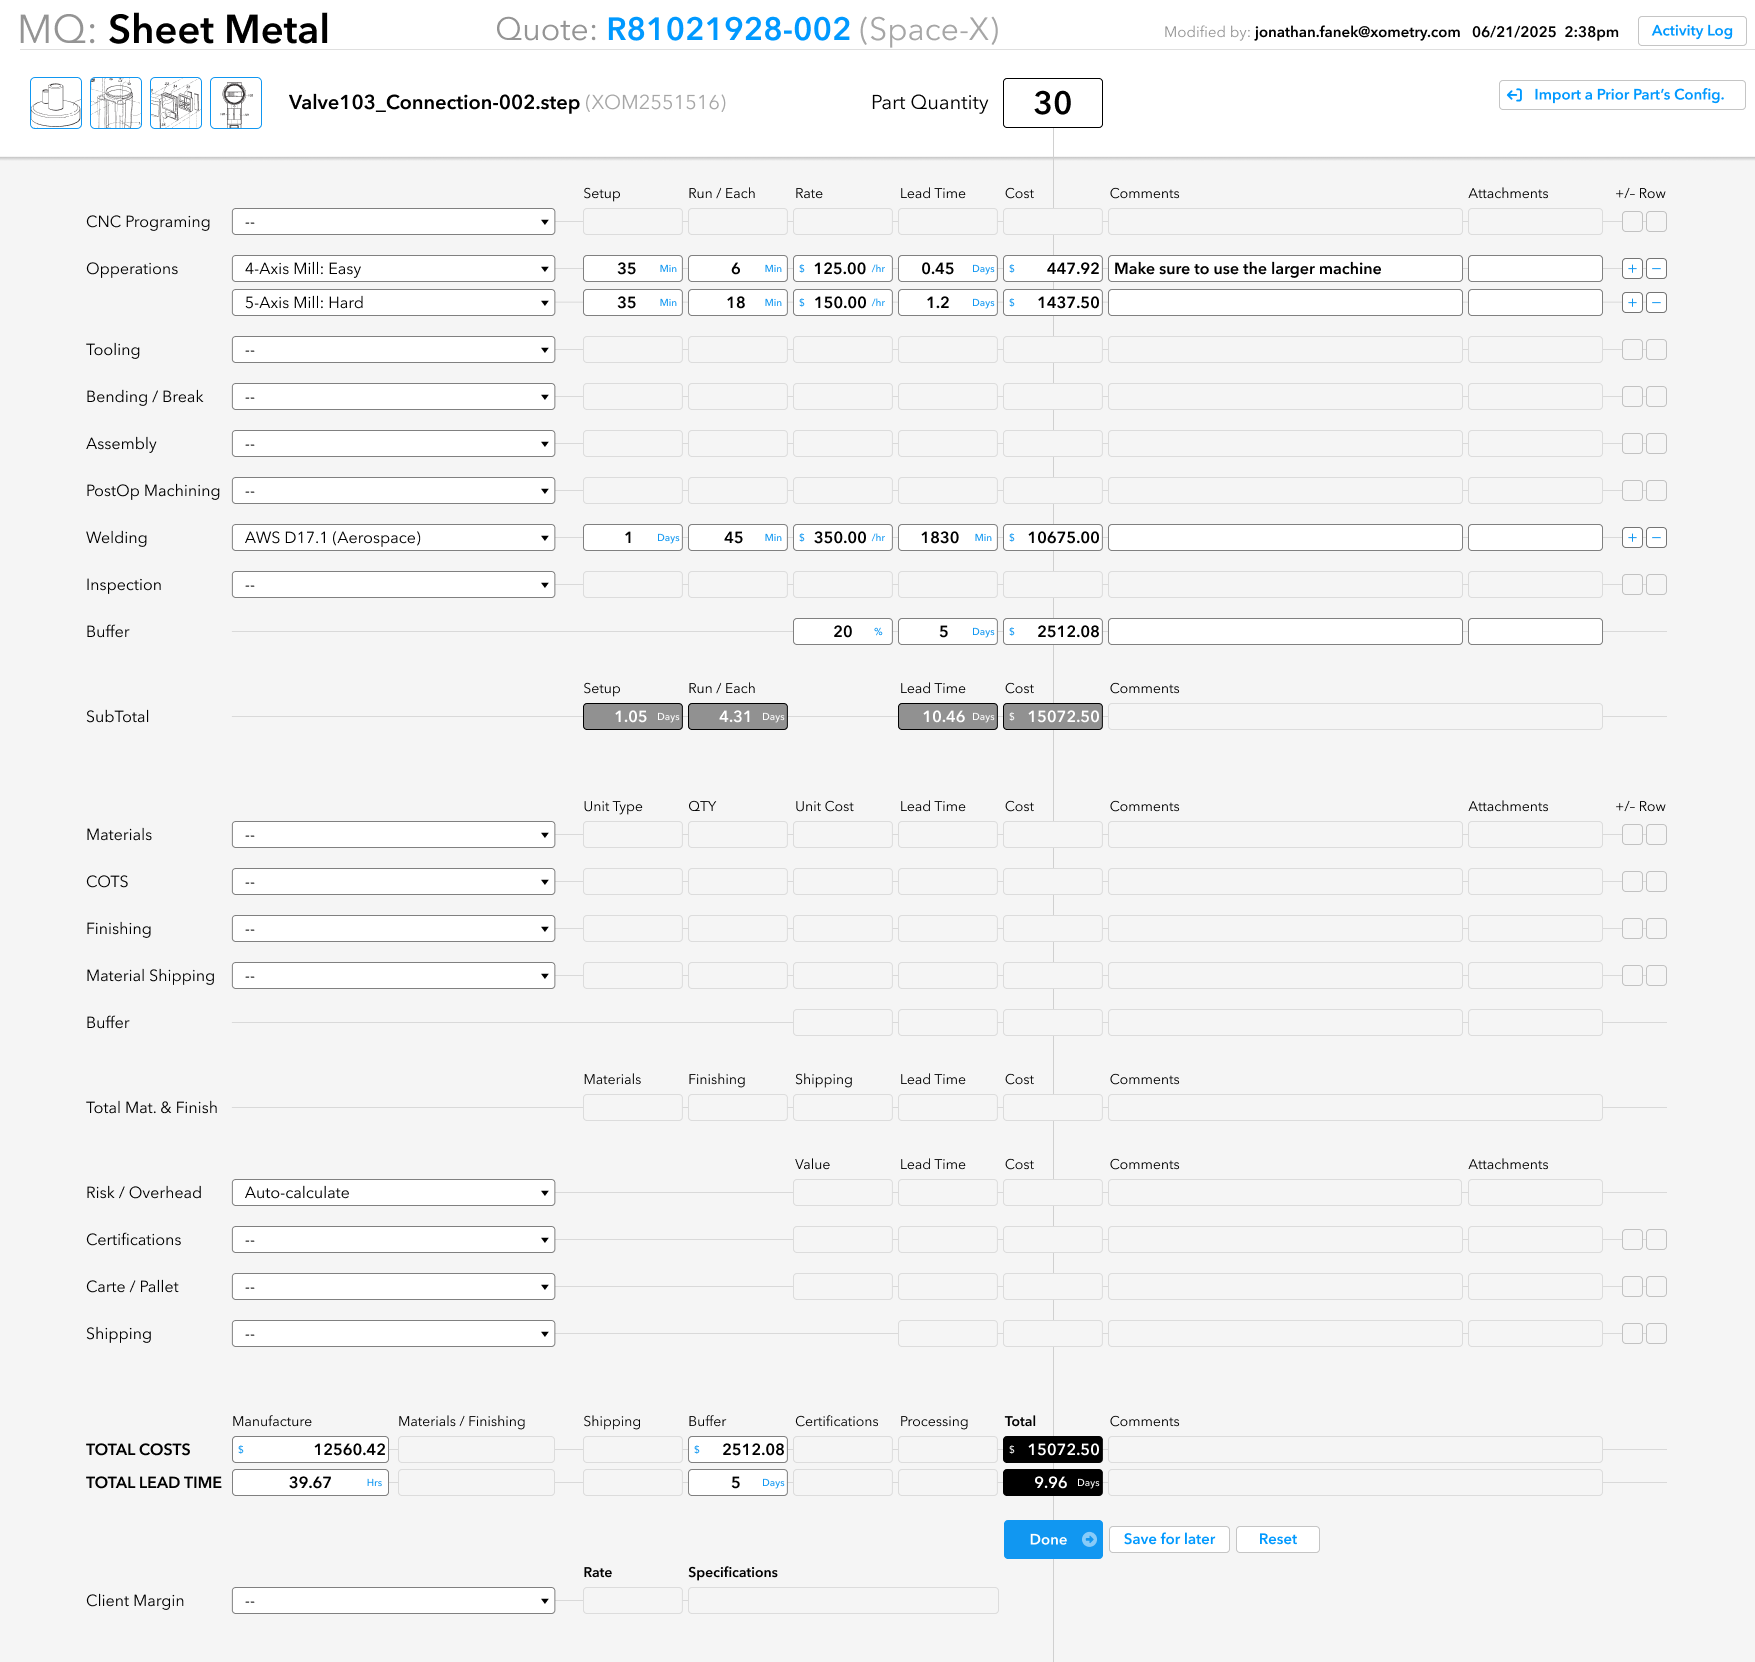
In order to be able to move away from the convoluted spreadsheet into a layout that would better accommodate future growth and easy expansion into new processes, it was clear that while the quoters were very supportive of change in general, we’d need to reuse as many components as possible so if the new cleaner layout were to be challenging for them, they would still be familiar with the concepts and processes.
In order to help the user focus only on the data they need, and to be able to ignore everything else, cells with null-state values are shown as disabled (blending into the background so as to avoid distractions from the relevant data.
By structuring the calculations to read from left to right and with all the costs in a single column it was not only easier to scan, it forced the team to rethink the complex web of ancillary calculations from the original spreadsheet which was long over-due. It was this rethinking of the calculation structures that made this exponentially more scalable to other groups manually quoting for other industrial manufacturing processes.
Processes
Materials
Finishing
Buffer
SubTotals
Risk Flags
Services
Total Cost
Total time
Margins
Shipping
Programming
Machining
Welding
Bending
Cutting
Risk remediation
Inspections
Manual Lookup
Structured lists
Alerts
Shipping Details
Time spent
Cost /hr
Cost /row
Notes
Add / remove rows
This model could be applied to all processes, materials, sub-processes, services, margins, risks, certifications, literally - everything.
I reviewed this model with the quoters and they estimated it would dramatically reduce the learning curve and save them millions in training costs.
I reviewed the model with lead developers and it would be a simple build once all the variants were worked out. They also said that since this model would combine hundreds of disparate data points, which would take a huge burden off the UI and off the developers - making more room for new features and dramatically increasing the speed with which they could deliver those features.
My Actions: Redesign
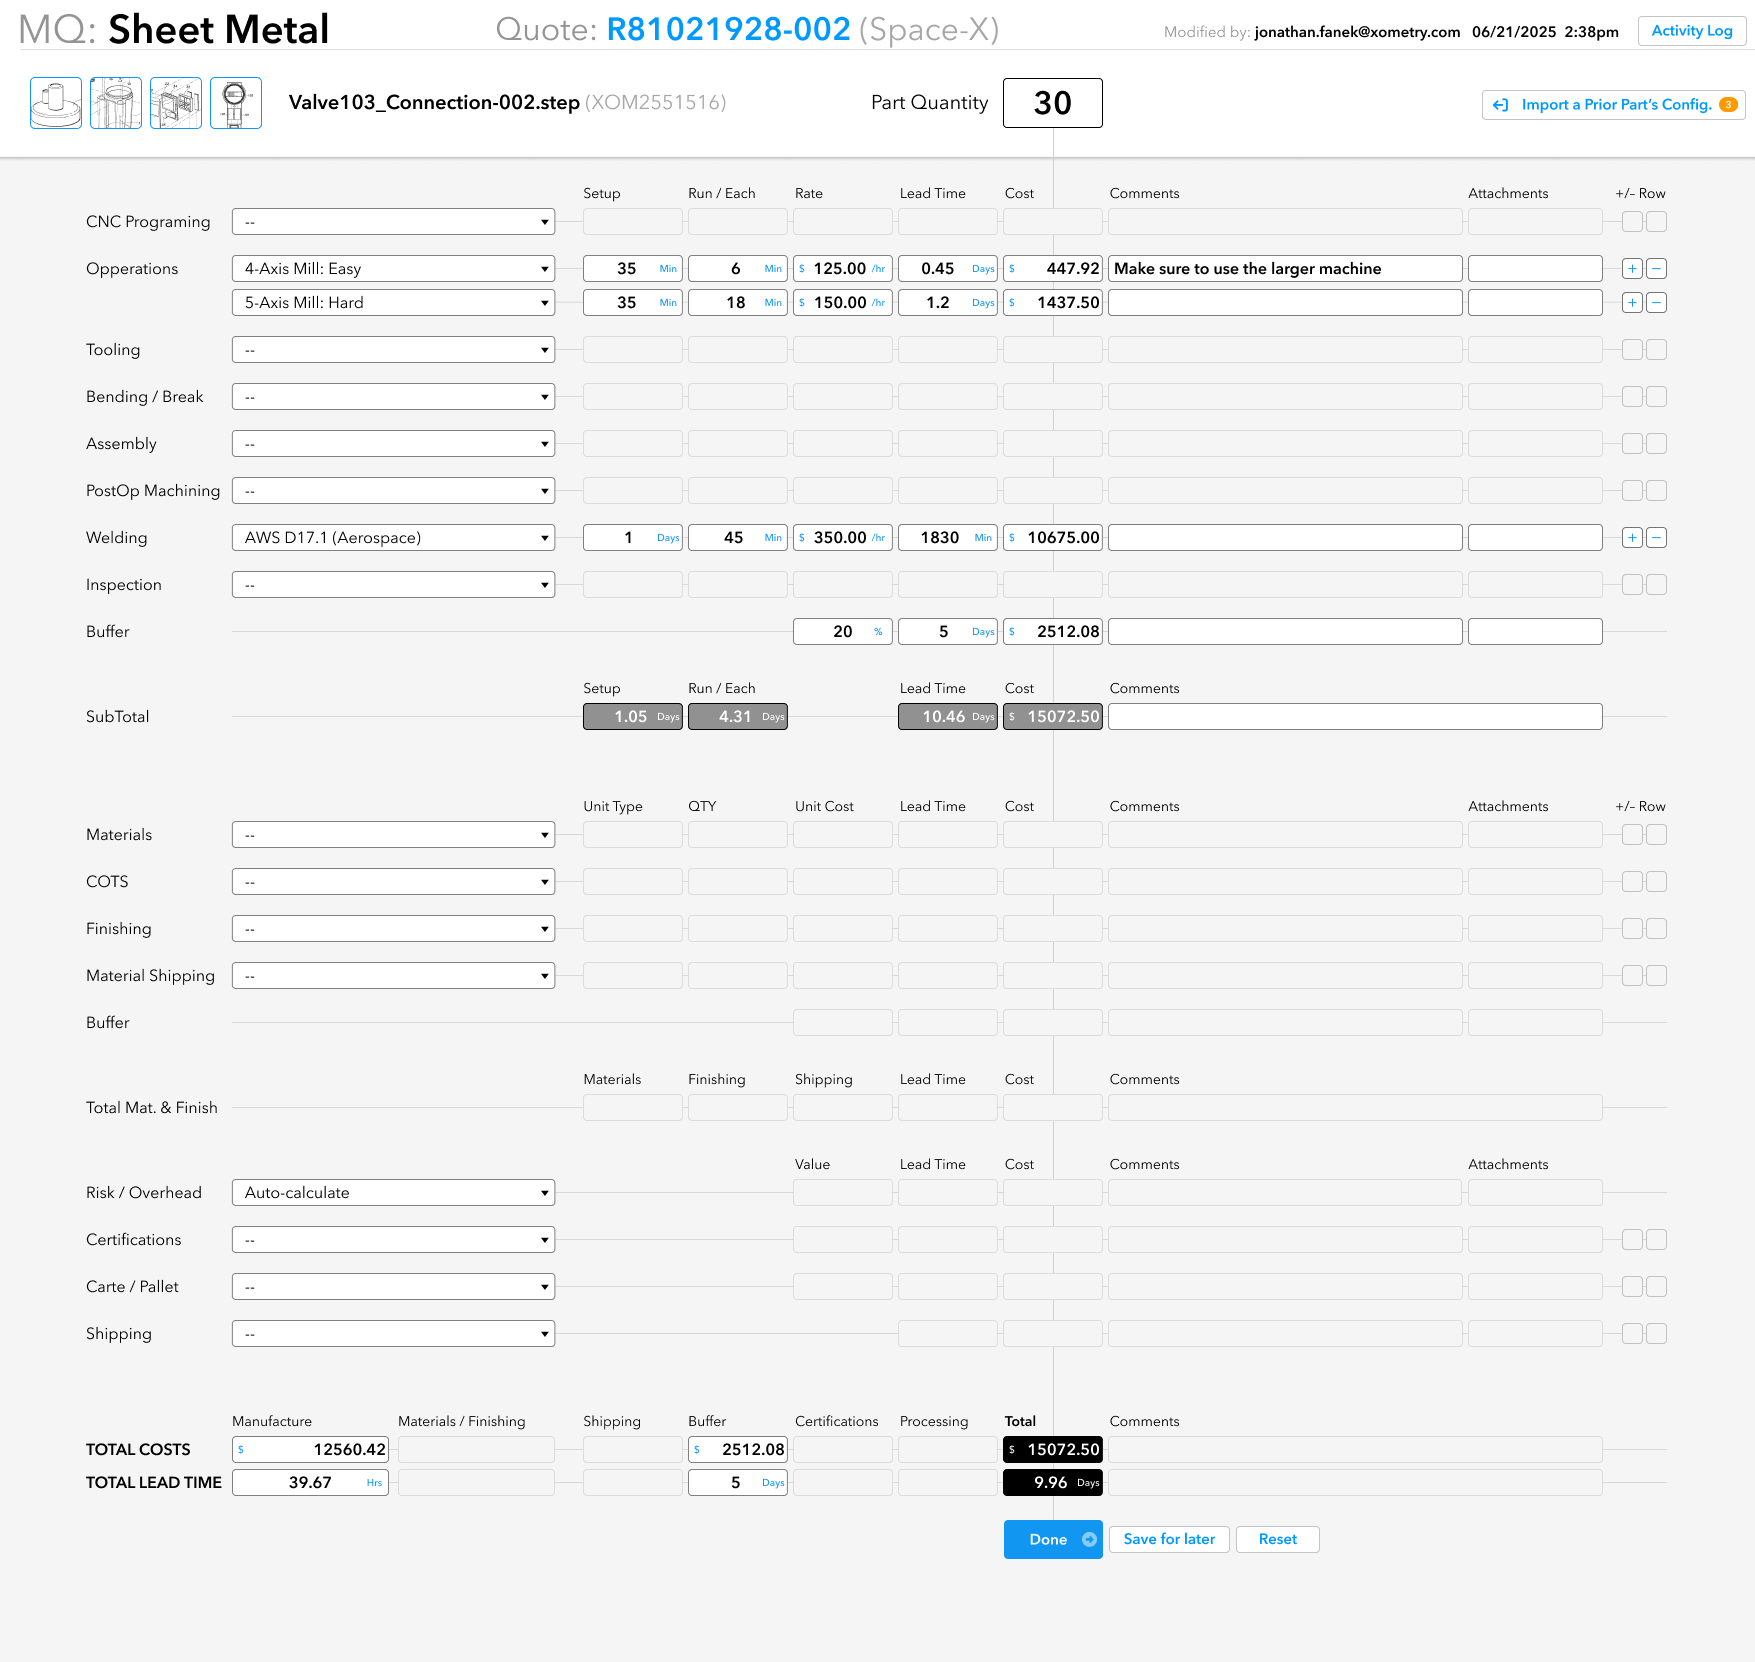
The more we designed, the more the quoters began to rethink which pieces were truly essential or just not needed, and began to think outside the boxes they’d been stuck with for so long and got really creative in how we brainstormed solutions to the ever deepening realm of edge-case nuances - which is how Continuous Discovery works best.
Process / Quote Info
Part QTY drives all calculations
Part Info
Production Processes
Quoter chooses which rows are needed
Production Buffer
Clear Subtotals
Production Materials
Finishing Processes
Shipping of Materials
Finishing Buffer
Risk is calculated
Light gray canvas allows active fields to be more obvious
Quote Totals
+ buttons duplicate a row into a group
– buttons remove a row from a group
All clutter... gone
Subtotals for null states are also disabled
Consistent primary and secondary buttons
My Actions: New Features: +/–
We learned that most quotes take less than 10 minutes to assess and configure, but the vast majority of the larger projects, often with multiple phases and huge profit margins can take months to review and price carefully. As this latter group formed the bulk of the transactional capital moving through the accounting system, so optimizing the UI for the edge cases or a one-size-fits-all approach, it made more sense to streamline the UI for the primary cases, but make it easy for the UI to be adapted for more complex parts. The amount of efficiency reclaimed from the majority cases far outweighed the gains from optimizing for the edge cases. Thus the +/– buttons were born.
The +/– buttons caused some concern among the devs working on the calculations, but because the quoters loved this feature so much that it was worth the time to adapt the math.
My Actions: New Features: RISK
Another obvious pain point was the way that risk was calculated for this one part. Risk was also calculated at the order-level, but for different reasons. Here risk is exclusively when the cost of the finishing labor and material exceeds 70% of the total cost of manufacturing. Sounds simple enough on paper, but the calculation is not simple.
IF [finishing subtotal – buffer] = >70% of [manufacturing subtotal – buffer] THEN calculate the amount to be added to the risk value so that <LS>[manufacturing subtotal - buffer] + [x] = 70% of [finishing subtotal - buffer]
This was done manually by quoters guessing at X until they got close enough to round up. So I standardized the equation so it made sense to everyone and then automated it. Quoters loved never having to think about that risk ratio again. There was, of course one crucial edge case wherein the customer is ordering a “Finishing-only” project without any manufacturing at all, such that the risk would appear to be incredibly high and only add unnecessary expense to the customer, so quoters needed the ability to override the auto-calculate-risk-rebalancing,
My Actions: New Features: IMPORT PART
When we were first learning about how quoters have to manually transpose the numbers for every field, file, image, service level, spec, process, certification and shipping details from the auto-quote to the manual quote, I brought up the idea of “if you know you’ve already quoted this exact part before, why not just use the previous part’s quote?” They looked at me like I had 12 heads. But the astonishment in that look told me that there was something in what I’d suggested that deserved more attention, rather than just pure shock, there was wonder in there too.
So I designed an AI-driven part lookup that would run as soon as the part was loaded and whenever the quoter wanted to look for something related manually.
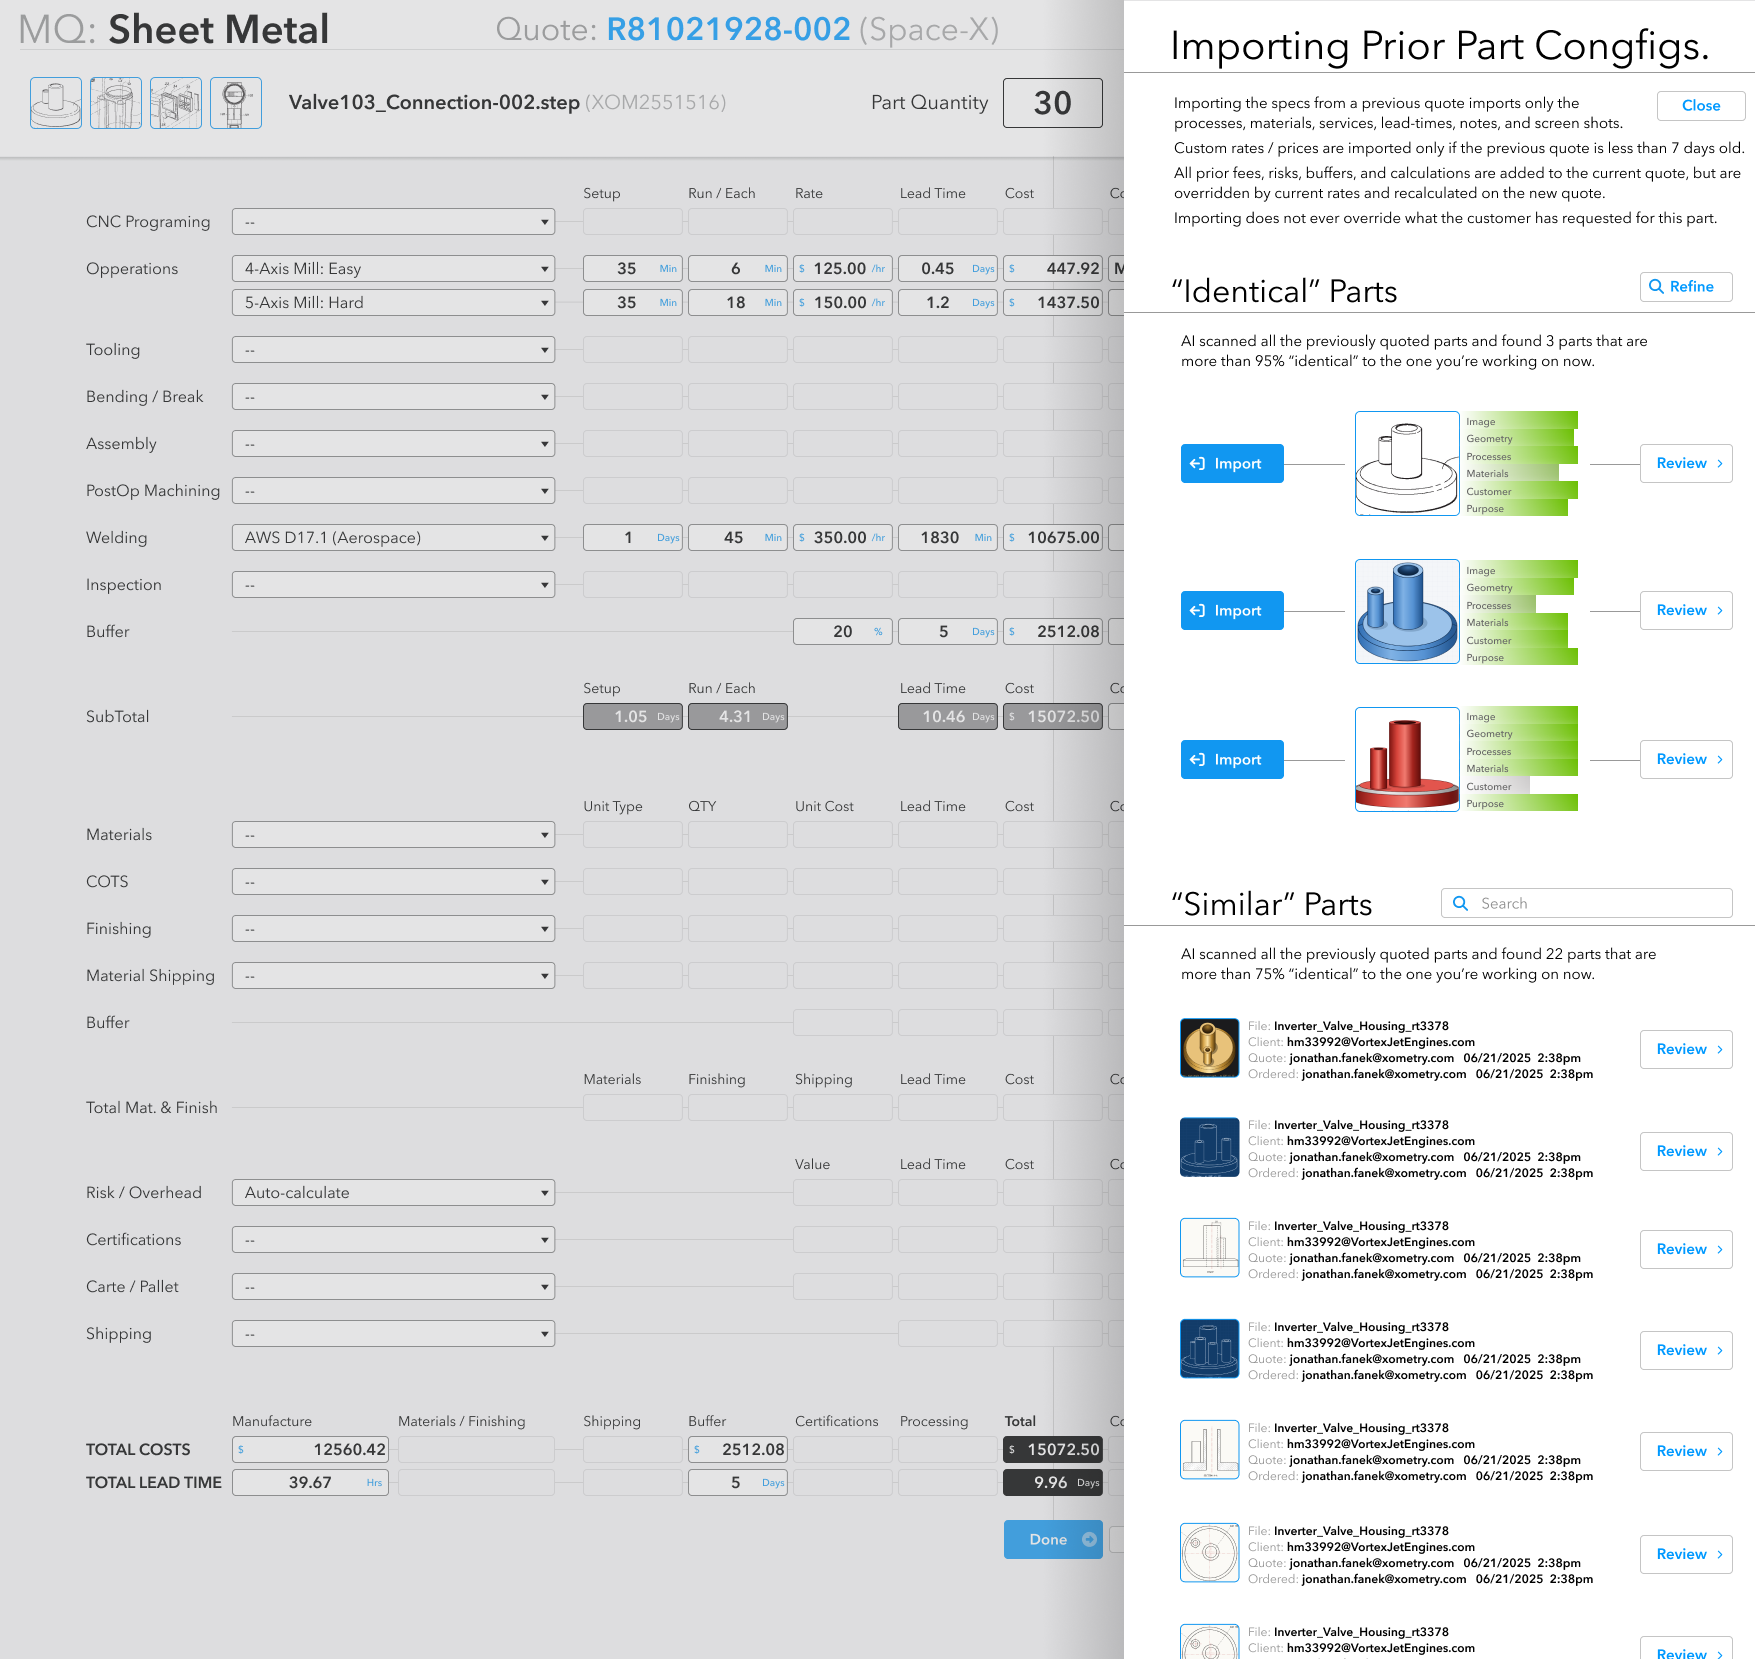 3 matches
Lookup panel slides in from the right
“Close” is in the exact same position as the “Open” button
Clear instructions
“Identical” parts can be further refined, training the AI
Scores are shown for each of the most crucial specs to instantly show the user why this was ranked so highly and where any gaps might need to be reviewed.
Parts the AI scores highly enough don’t need confirmation specs at this level, only the scores, and can be directly imported from this list.
2 clicks to complete a quote from a pre-existing quote (30 seconds), compared with importing it manually (45+ clicks) or recreating it from scratch (3 hours).
Searching within, or beyond what the AI flagged as “Similar”
Since the AI scored these parts as “similar” but far from “identical” they cannot be imported directly from this list. Instead their primary specs are shown so the user can decide which ones to review in more detail and can then import the part’s specs from the detailed view.
My Actions: Prototype + Proving Value
All the quoters we spoke with and especially those with whom we reviewed the designs, loved the direction - specifically the ability to focus without having to tune out all the noise, even though it meant slightly more work to declare what was relevant, it was still better than burn out. But still the questions remained - would this truly increase capacity or just look cleaner?
So I built the prototype and created a simple usability test to prove that this was the right direction.
While the more senior quoters would likely have a bit of a shock at having all the familiar noise removed, we suspected but still needed to prove that they would quickly find what they needed and be able to use the new tool at the same speed as the original spreadsheet by their third quote. As with all niche user groups, exposure to design thinking was minimal and so we tested it not only based on their personal opinions, but also on the empirical usage data.
First Impressions
User Acceptance Testing
Scoring
New hires loved it immediately, especially compared to learning the spreadsheets, but more senior users with their vast familiarity with the spreadsheets struggled initially. We knew this would be the case and wanted to show stakeholders that we were not biasing the results.
Then I let them take control of the prototype and do a series of timed quotes (which required them to use the new features repeatedly). This showed everyone how quickly they would accept the changes and highlighted any remaining sticking points.
I also designed the scoring system for the test to allow the rest of the team to do the scoring to corroborate impressions and prevent any one person from biasing the results.
Reception

Growth MindsetWhat I learned:
While I already knew to respect the expertise of niche / elite users, this level of complexity / speed / pressure / money brought my respect for this group to a whole new level.
Respect for “familiarity bias” is essential for developing empathy for niche users who, though they may hate the current software, are also loath to change it until they are fully onboard, so take the extra time.
Without enough respect there can be no humility and no empathy, which makes mis-steps and re-work more likely.
To build trust: first prove detractors are correct before showing them there is more to it - let them see it for themselves.
Impression tests are fast, but letting users try out the tools for themselves in a familiar context yields irrefutable results.
When an under-served community is truly listened to and treated like human beings – the gratitude can be overwhelming.
This project reinforced my commitment to Design being an act of compassion.